Resource usage
The server's CPU, memory, disk and traffic over time.
Resource usage shows how hard the server is working right now and has been working. Use it to find out what is slowing the server down. The Live card at the top updates every 2 seconds; the charts below are sampled every 5 minutes. Which accounts use the most is on Top accounts.
Where: Server Admin › Server › Resource usage (tabs Resource usage and Capacity forecast)
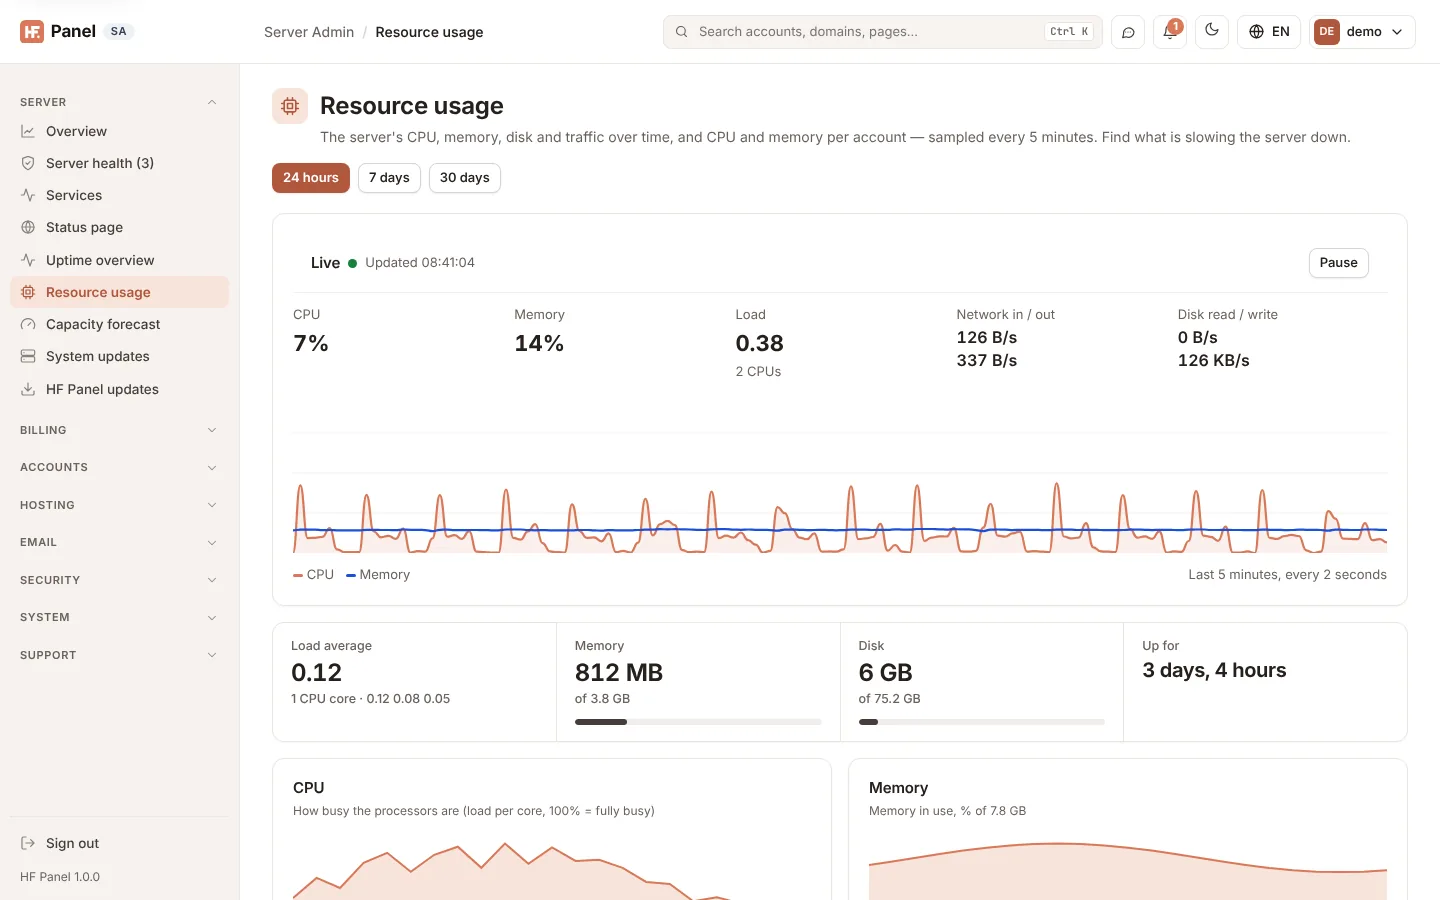
Live figures
The Live card at the top shows the server as it is now, updated every 2 seconds:
| Figure | What it shows |
|---|---|
| CPU | How busy the processors are, across all of them |
| Memory | The memory in use (what programs can't get back without swapping) |
| Load | The 1-minute load average, with the number of CPUs under it: a load near or above that number means work is waiting |
| Network in / out | Bytes per second received and sent, all network cards together |
| Disk read / write | Bytes per second read from and written to the disks |
The chart shows CPU and memory over the last 5 minutes, the newest reading on the right. Point at it to see the values at that moment. Click Pause to hold the figures while you look; Resume carries on. The card stops reading while the browser tab is in the background, and the server only measures while someone has the card open.
The same card, without network and disk, is on the Overview.
Choose the period
Click 24 hours, 7 days or 30 days at the top. The server charts cover the whole period.
Figures now
| Figure | What it shows |
|---|---|
| Load average | The 1-minute load average, with the number of CPU cores and the 1, 5 and 15-minute averages underneath. |
| Memory | Memory in use, out of the total, with a bar that turns red above 90 %. |
| Disk | Disk space in use, out of the total, with a bar that turns red above 90 %. |
| Up for | How long since the server last started. |
Charts
| Chart | What it shows |
|---|---|
| CPU | How busy the processors are: load per core, where 100 % means fully busy. |
| Memory | Memory in use as a percentage of the total. |
| Disk | Space used on the server's disk, in GB. |
| Traffic | Data in and out of the server, in MB per 5 minutes (24 hours), per hour (7 days) or per 4 hours (30 days), with the totals in and out. |
Each chart shows when it starts and its peak value. Until the server has collected its own history, you see Server load and Server memory used (MB) charts instead, built from the account samples. A chart says Not enough data yet until there are at least two samples.
Busiest accounts
The accounts' CPU, memory, processes, disk and limit hits are on Top accounts (Manage in Top accounts at the foot of the page), sorted by any of them, with one account's charts and limits.
Tip: to stop one account slowing everyone down, give its package CPU and memory limits and enforce them under Packages. See also Account isolation.